What is MFAANG or FAANG?
FAANG stocks, you might have heard about them. They are a group of 5 tech stocks, namely Facebook, Apple, Amazon, Netflix, and Google. I like to include another tech giant in the group, Microsoft, and track them together as MFAANG.
So, why are these stocks famous and discussed very often? Because they have been leading the tech revolution for a while now.
Live FAANG Stock Prices
MFAANG (Microsoft + FAANG) Snapshot
The six stocks in MFAANG have a combined market cap worth a staggering $8.5+ TRILLION [March 2022].
MFAANG Latest Earnings Date
Microsoft Latest Earnings Data
Facebook (META) Latest Earnings Data
Amazon Latest Earnings Data
Apple Latest Earnings Data
NETFLIX Latest Earnings Data
Google (Alphabet) Latest Earnings Data
MFAANG stock performance
Let’s evaluate the performance of these stocks in the previous decade, from Jan 2010 to Jan 2020.
| STOCK | % GAINS Jan 2010 – Jan 2020 | VALUE OF $1000 INVESTED |
|---|---|---|
| MSFT | 435% | $ 5,350 |
| FB | 470% | $ 5,700 |
| AAPL | 1027% | $ 11,270 |
| AMZN | 1364% | $ 14,640 |
| NFLX | 4541% | $ 46,410 |
| GOOG | 387% | $ 4,870 |
| Total $ 88,240 | ||
| SP 500 | 188% | $ 2,880 |
FB start price as of May 2012
$6,000 invested in M-FAANG stock at the start of the decade ($1,000 in each stock) would be worth a total of $88,240 in Jan 2020.
For comparison, investing $6,000 in S&P 500 in Jan 2010 would be worth $17,280 in Jan 2020.
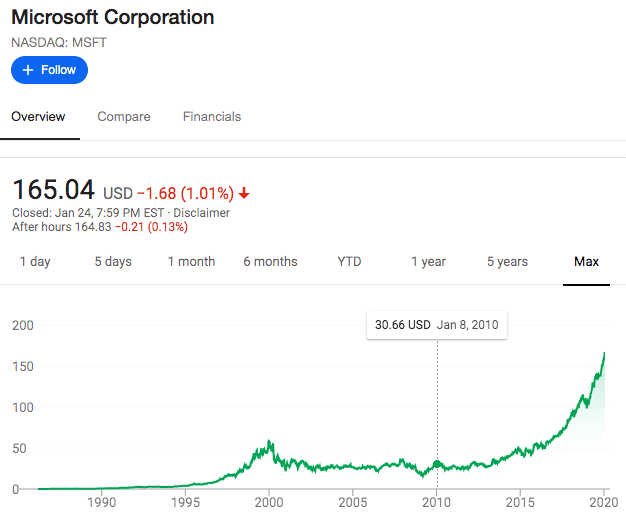
Microsoft Stock: From $30.66 to $165.04 in a decade
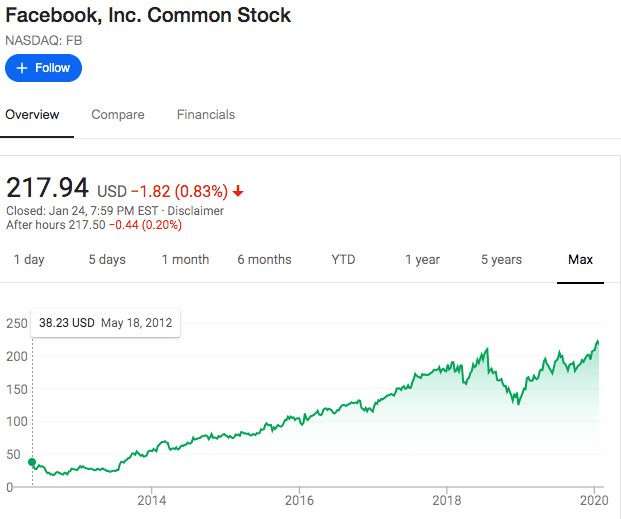
Facebook Stock: From $38.23 to $217.94 in less than a decade
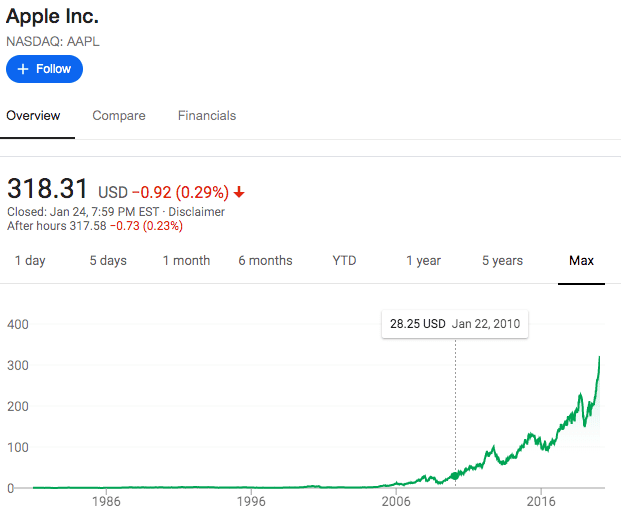
Apple Stock: From $28.25 to $318.31 in a decade
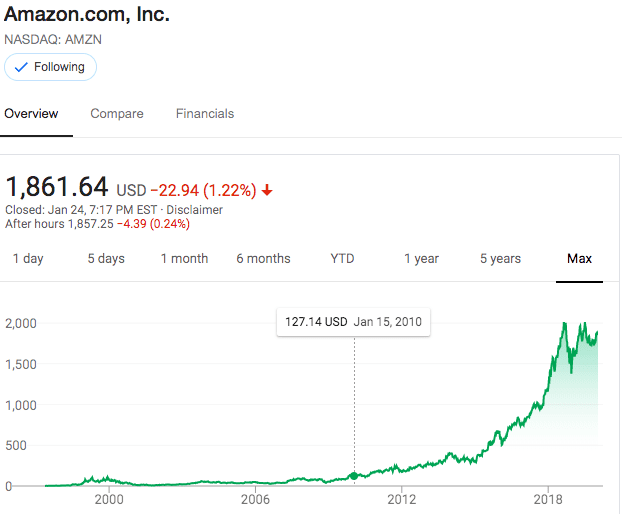
Amazon Stock: From $127.14 to $1861.64 in a decade
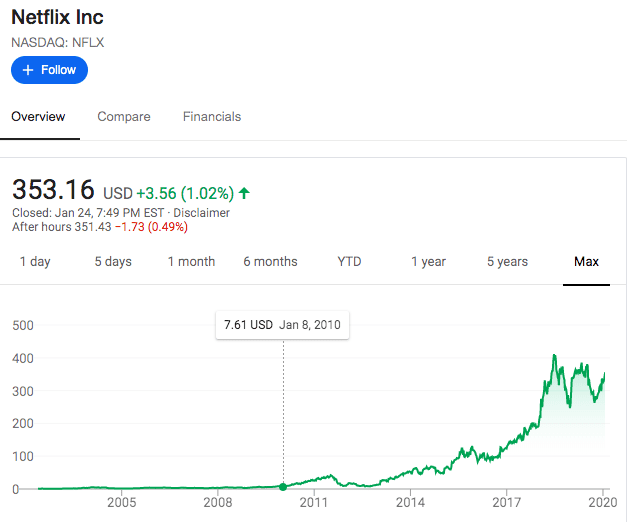
Netflix Stock: From $7.61 to $353.16 in a decade
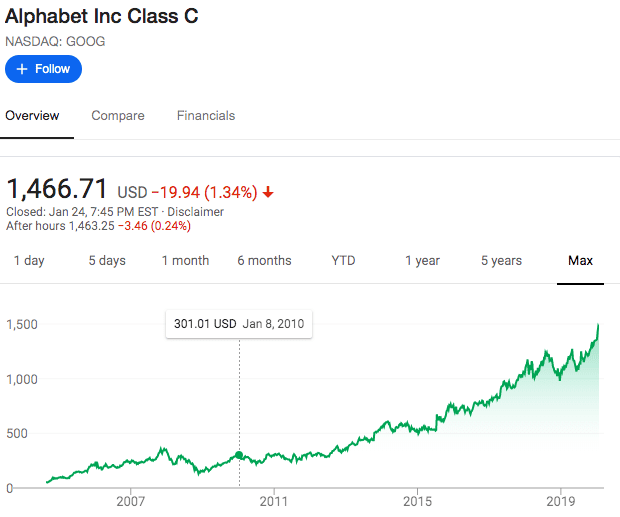
Alphabet Stock: From $301.01 to $1466.71 in a decade
All images are screenshots from google finance
Did you have any MFAANG stocks this decade? Let us know in the comment section below.
MFAANG 2020 YTD Performance
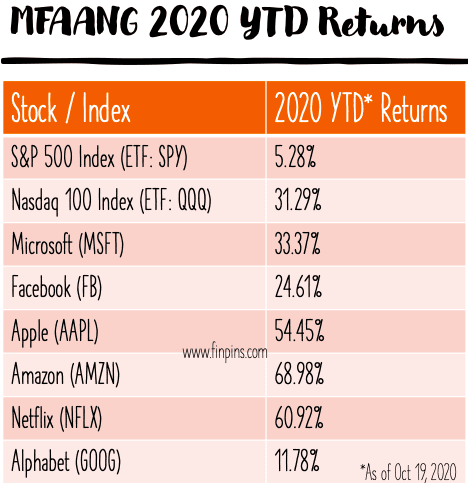
As of writing this section, Oct 19, 2020, let’s take a look at the 2020 Year to date performance of MFAANG stocks and how they compare against the S&P 500 and Nasdaq 100 Indexes. The best returns were on the Amazon stock (almost 69%) and the lowest return were on Alphabet (Google) stock (under 12%). Still, each MFAANG stock beat the S&P 500 returns (5.28%) YTD.
| Stock / Index | 2020 YTD Returns (as of Oct 19, 2020) |
| S&P 500 Index (ETF: SPY) | 5.28% |
| Nasdaq 100 Index (ETF: QQQ) | 31.29% |
| Microsoft (MSFT) | 33.37% |
| Facebook (FB) | 24.61% |
| Apple (AAPL) | 54.45% |
| Amazon (AMZN) | 68.98% |
| Netflix (NFLX) | 60.92% |
| Alphabet (GOOG) | 11.78% |
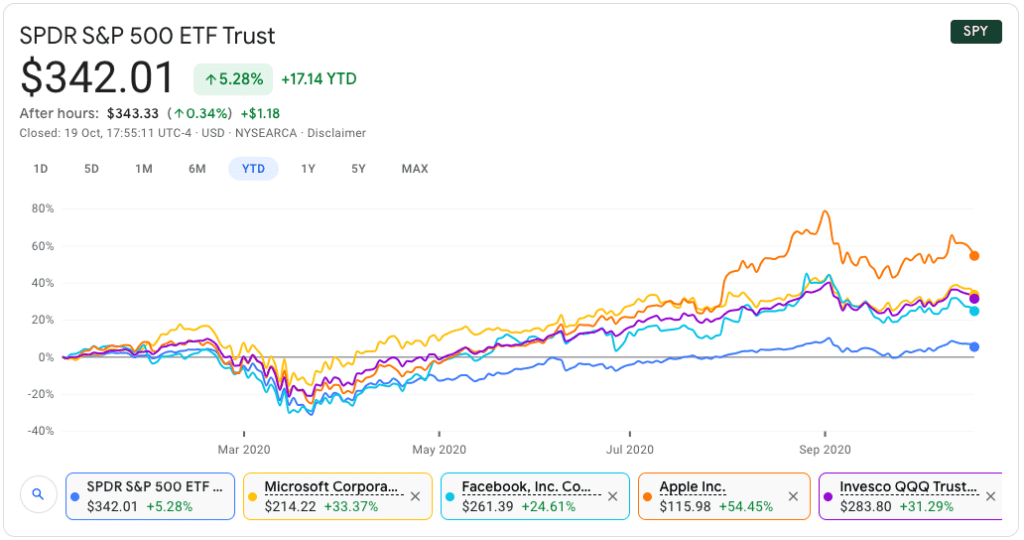
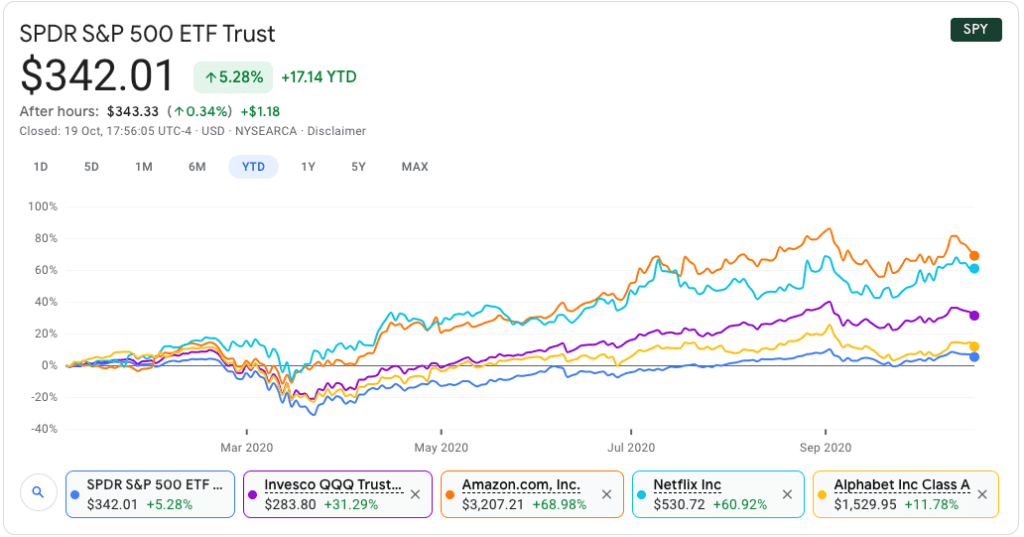
YTD chart image screenshots from google finance
MFAANG Earnings by service and product segments
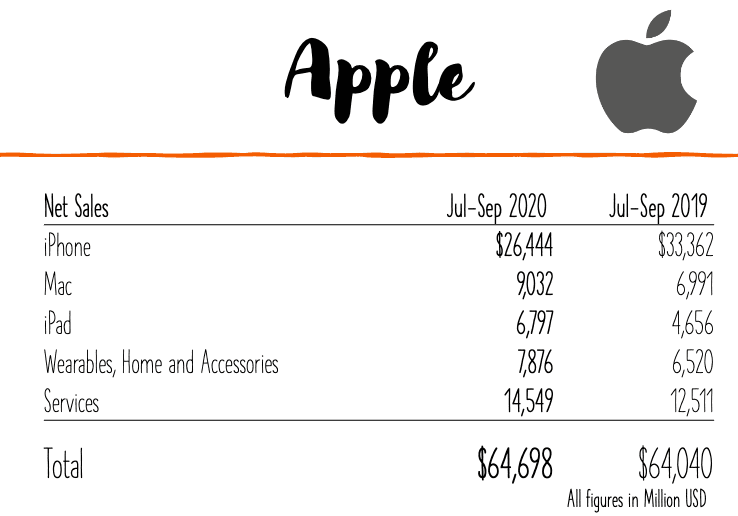
Apple Earnings by Segment (in million USD)
Apple Previous Earnings Data
| Apple Quarterly Net Sales | Jul-Sep 2020 | Jul-Sep 2019 |
|---|---|---|
| iPhone | $ 26,444 | $ 33,362 |
| Mac | 9,032 | 6,991 |
| iPad | 6,797 | 4,656 |
| Wearables, Home and Accessories | 7,876 | 6,520 |
| Services | 14,549 | 12,511 |
| Total | $ 64,698 | $ 64,040 |
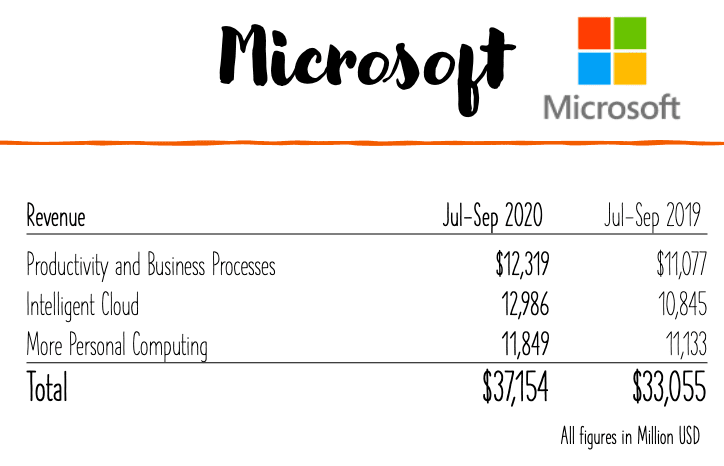
Microsoft Earnings by Segment (in million USD)
Microsoft Previous Earnings Data
| Microsoft Quarterly Revenue | Jul-Sep 2020 | Jul-Sep 2019 |
|---|---|---|
| Productivity and Business Processes | $ 12,319 | $ 11,077 |
| Intelligent Cloud | 12,986 | 10,845 |
| More Personal Computing | 11,849 | 11,133 |
| Total | $ 37,154 | $ 33,055 |
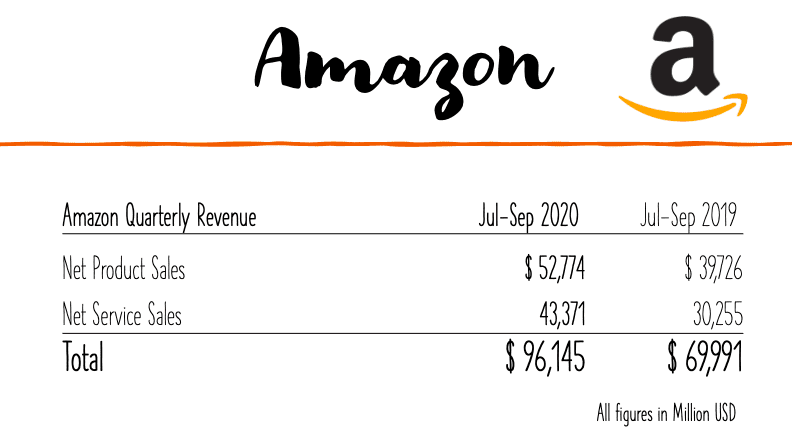
Amazon Earnings by Segment (in million USD)
Amazon Previous Earnings Data
[update Feb 2021]
Q4 FY 2020 Earnings: Net Sales $125.6 Billion
Full Year FY 2020: Net Sales $386 Billion
Net sales increased 38% to $386.1 billion, compared with $280.5 billion in 2019. Excluding the $1.4 billion favorable impact from year-over-year changes in foreign exchange rates throughout the year, net sales increased 37% compared with 2019.
Operating income increased to $22.9 billion, compared with operating income of $14.5 billion in 2019.
Net income increased to $21.3 billion, or $41.83 per diluted share, compared with net income of $11.6 billion, or $23.01 per diluted share, in 2019.
– Amazon Investor Relations Website
| Amazon Quarterly Revenue | Jul-Sep 2020 | Jul-Sep 2019 |
|---|---|---|
| Net Product Sales | $ 52,774 | $ 39,726 |
| Net Service Sales | 43,371 | 30,255 |
| Total | $ 96,145 | $ 69,991 |
Is There an ETF for MFAANG?
While we could not find a readily available ETF to invest in the MFAANG stocks, the good news is you can easily create your own equivalent on M1 finance.
See the step by step tutorial on how to create a pie or portfolio on M1
Direct Access to MFAANG Pie on M1
Are There ETFs for Artificial Intelligence?
The MFAANG stocks have brought phenomenal returns for investors over the past few years. Do you believe the next phase of explosive growth would come from the companies working on Machine Learning and Artificial Intelligence? Here are some ETFs that you might want to look at.
For more on ETFs, check out What is ETF?

Read more
Popular Topics: Stocks, ETFs, Mutual Funds, Bitcoins, Alternative Investing, Dividends, Stock Options, Credit Cards
Posts by Category: Cash Flow | Credit Cards | Debt Management | General | Invest | Mini Blogs | Insurance & Risk Mgmt | Stock Market Today | Stock Options Trading | Technology
Useful Tools
Student Loan Payoff Calculator | Mortgage Payoff Calculator | CAGR Calculator | Reverse CAGR Calculator | NPV Calculator | IRR Calculator | SIP Calculator | Future Value of Annuity Calculator
Home | Blog
Page Contents